
Trade
Volatility Stop
A stop-loss line that follows the price at a safe distance.
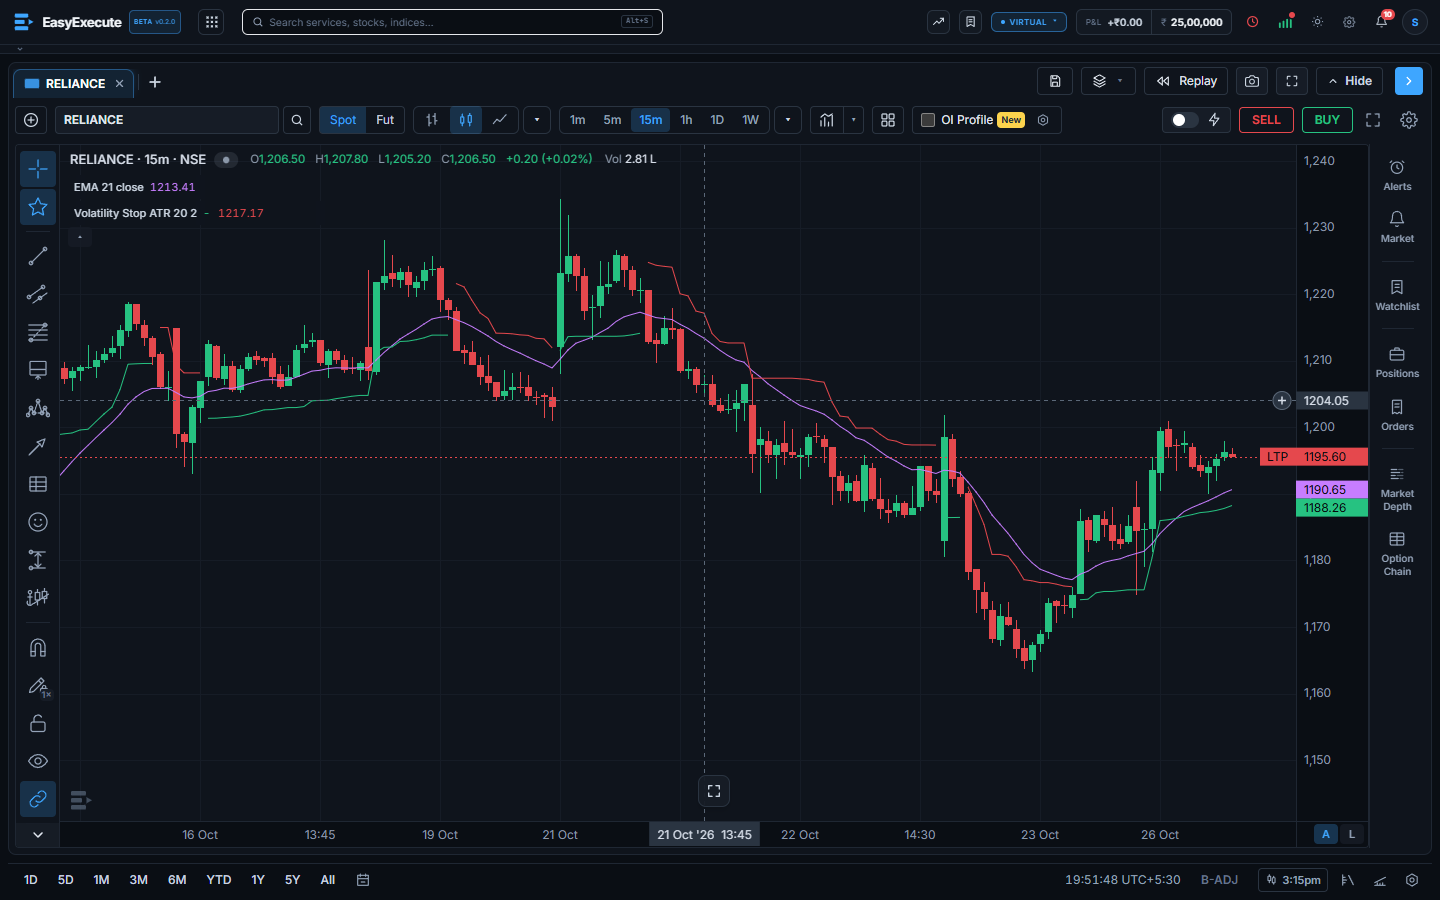
Volatility Stop draws a stop-loss line on the chart. In an up trend it sits under the price and only moves up. In a down trend it sits over the price and only moves down. When the price closes through it, the trend flips and the line starts again on the other side.
What you can do
- Add it from Indicators (search volatility stop, stoploss or trailing stop). It is in the Trend group.
- Green line: an up trend. Use it as a trailing stop for a long position. Red line: a down trend. Use it for a short position.
- The distance is set by volatility. Pick the kind in the settings: ATR (the average candle range), HV (how far the price really moves, from past price changes) or IV (how far the market expects it to move, from the India VIX).
- Length (for ATR and HV), the price it uses and the multiplier are in the settings too. A bigger multiplier keeps the line further away, so it is hit less often.
- The HV and IV distances are based on close-to-close moves, so they are usually tighter than ATR. Change the multiplier when you switch from one kind to another.
- The IV kind uses the India VIX for every symbol. It is the market’s expected volatility, not the volatility of one stock. Until the VIX data arrives, no line is drawn.
- It is a guide for a stop, not an order. It does not place or close any trade.