
Trade
Layouts
Your saved chart screens.
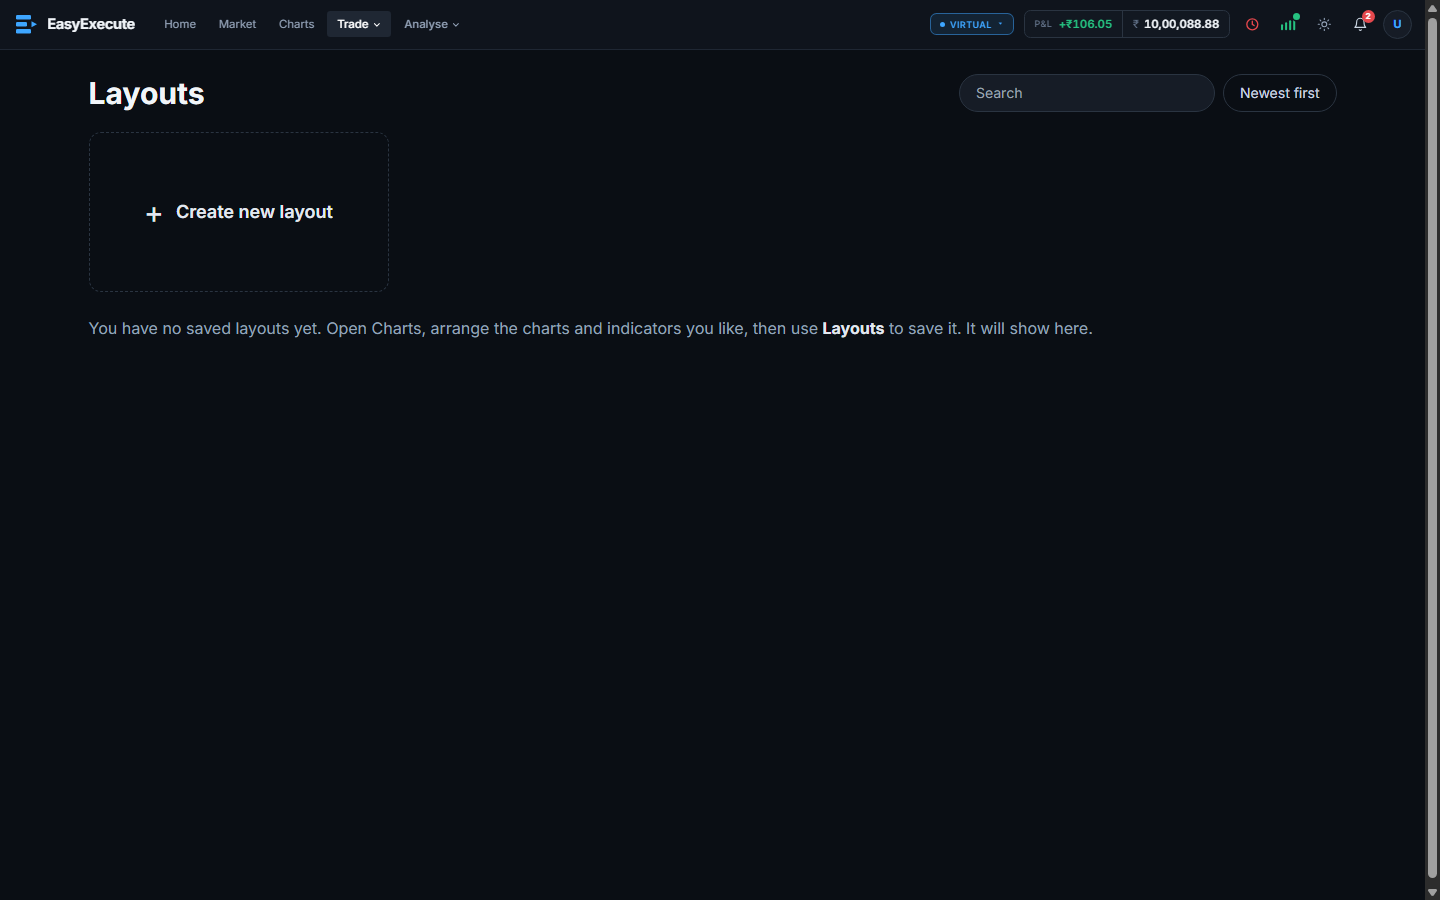
A layout is a saved chart screen, with its symbol, time frame, indicators and drawings, so one click brings your whole setup back.
What you can do
- The list shows the newest first. Each card shows the symbol, the time frame, how many indicators it has and the date.
- + Create new layout starts a new one, and the star marks your favourites.
- The menu on each card lets you open, rename or delete a layout.
Several charts on one screen
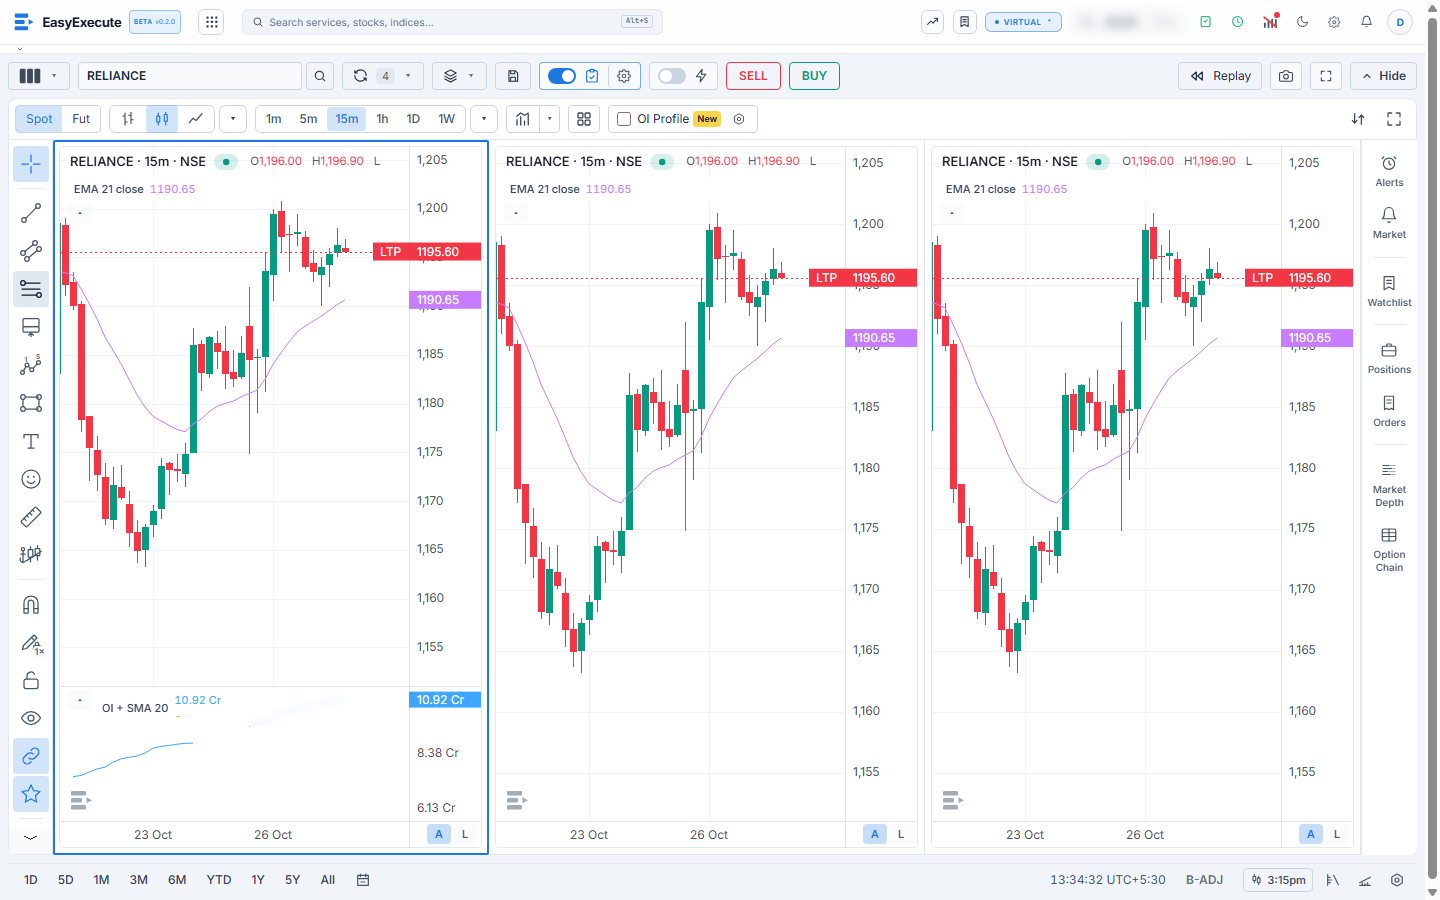
On the Charts page, the layout button next to the symbol box picks how many charts you see, from 1 to 9, in many arrangements. The charts touch each other and share one header and one drawing toolbar, so more of the screen is chart. Drag the line between two charts to change their sizes. Click a chart to select it; a blue border shows which chart is in use.
Sync in layout
The Sync button keeps the charts in step. Switch on only what you want:
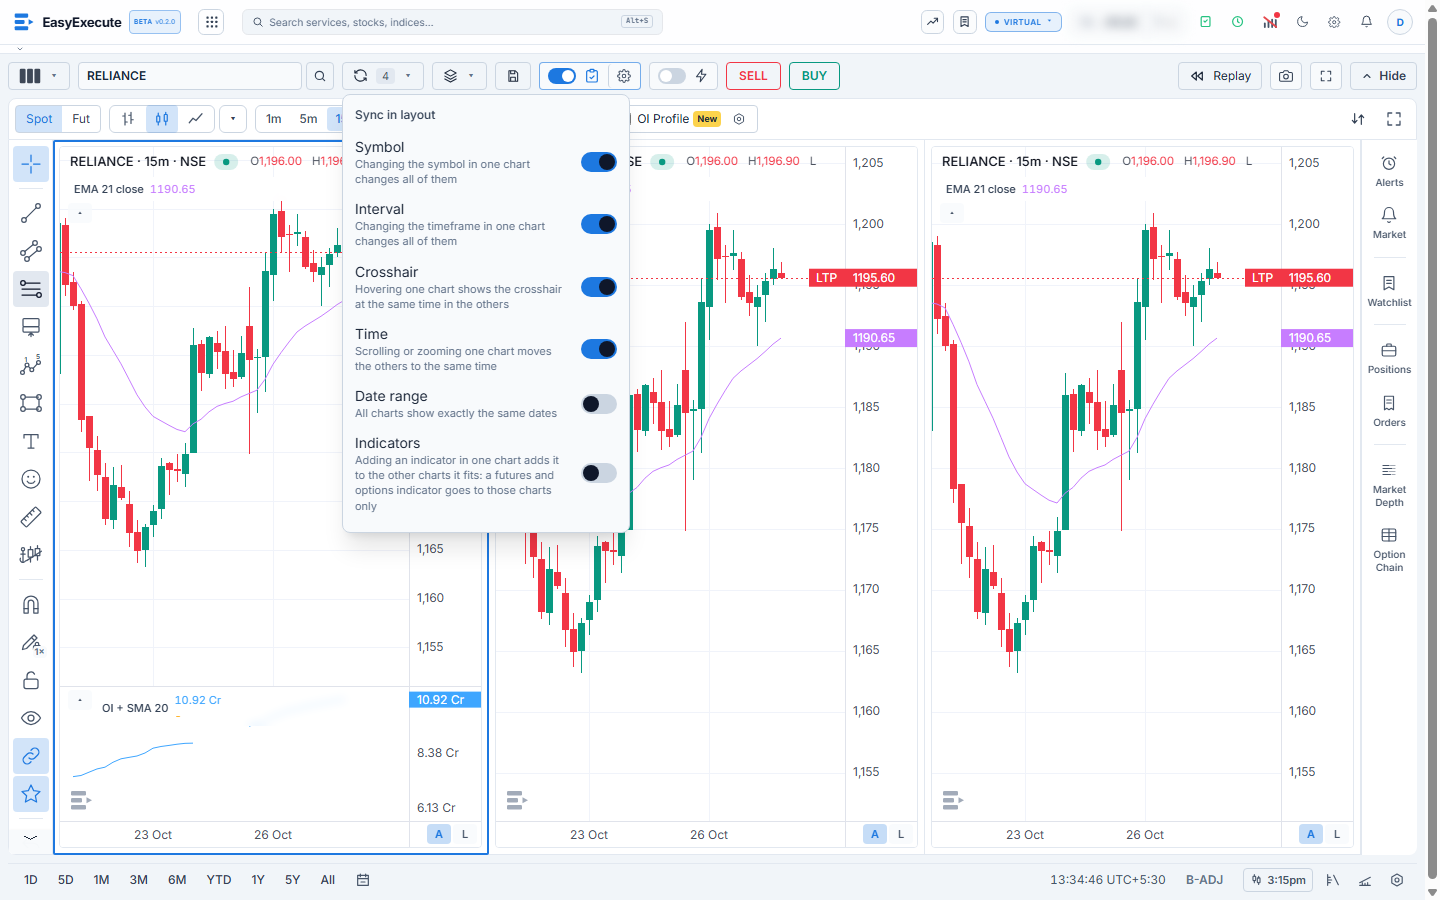
- Symbol and Interval: change one chart and all the others follow.
- Crosshair: point at a candle in one chart and the same time lights up in the others.
- Time and Date range: scroll or zoom one chart and the others move with it, or all show exactly the same dates.
- Indicators (off until you switch it on): add an indicator in one chart and it is added to the other charts it fits. Remove it, change its settings or hide it, and the other charts do the same. An indicator made only for futures and options (such as open interest) is added to the futures and option charts only, never to a stock or index chart, so those charts may show different indicators.
- Indicator templates follow too: with Indicators sync on, press a saved template on one chart and every other chart takes the same set of indicators in place of its own. An indicator that does not fit a chart (for example open interest on a stock chart) is left out of that chart. With Indicators sync off, a template changes only the chart you pressed it on.
Put one indicator template on every chart
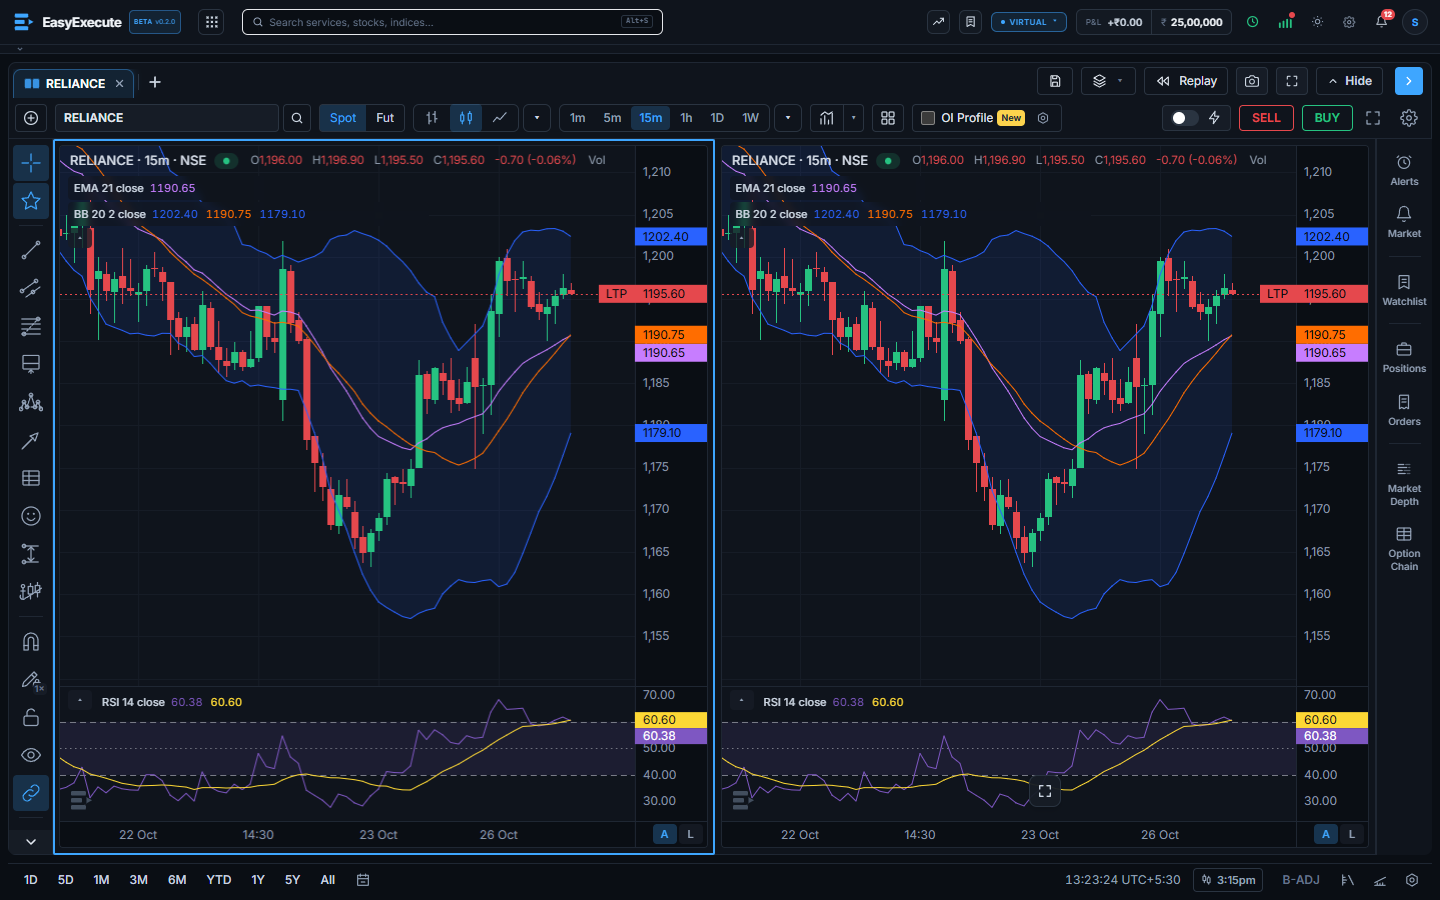
Switch Indicators sync on, then open the Indicator templates menu on any chart. Here two charts show only an EMA, and the template My Setup (EMA, Bollinger Bands and RSI) is ready.
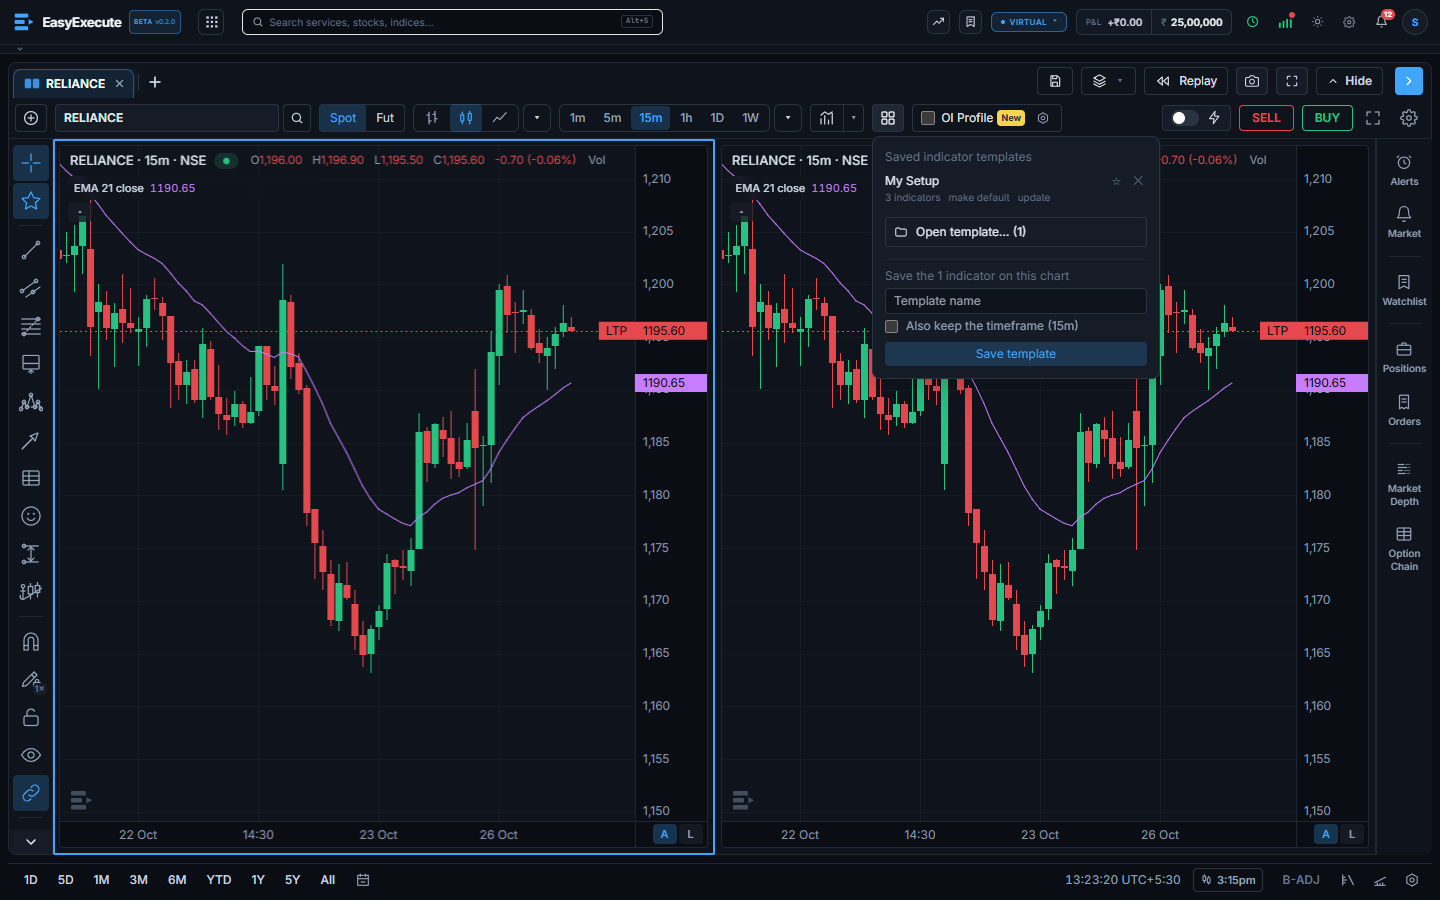
Press the template once. Both charts now show the same indicators: the Bollinger Bands on the price and the RSI below it.
Hide the clutter, or remove it from every chart
- Two small icons at the right end of the bar under the charts hide or show the price scale (the numbers on the right) and the time scale (the dates at the bottom) on every chart. You can also right-click a chart to hide them for that chart alone.
- In the drawing toolbar, the bin button has extra items in a layout: Remove all drawings, Remove all indicators, or both, from every chart at once.
- The side panel (Alerts, Watchlist, Positions, Orders, Market depth, Option chain) follows the chart you selected.