
Analyse
Strategy Chart
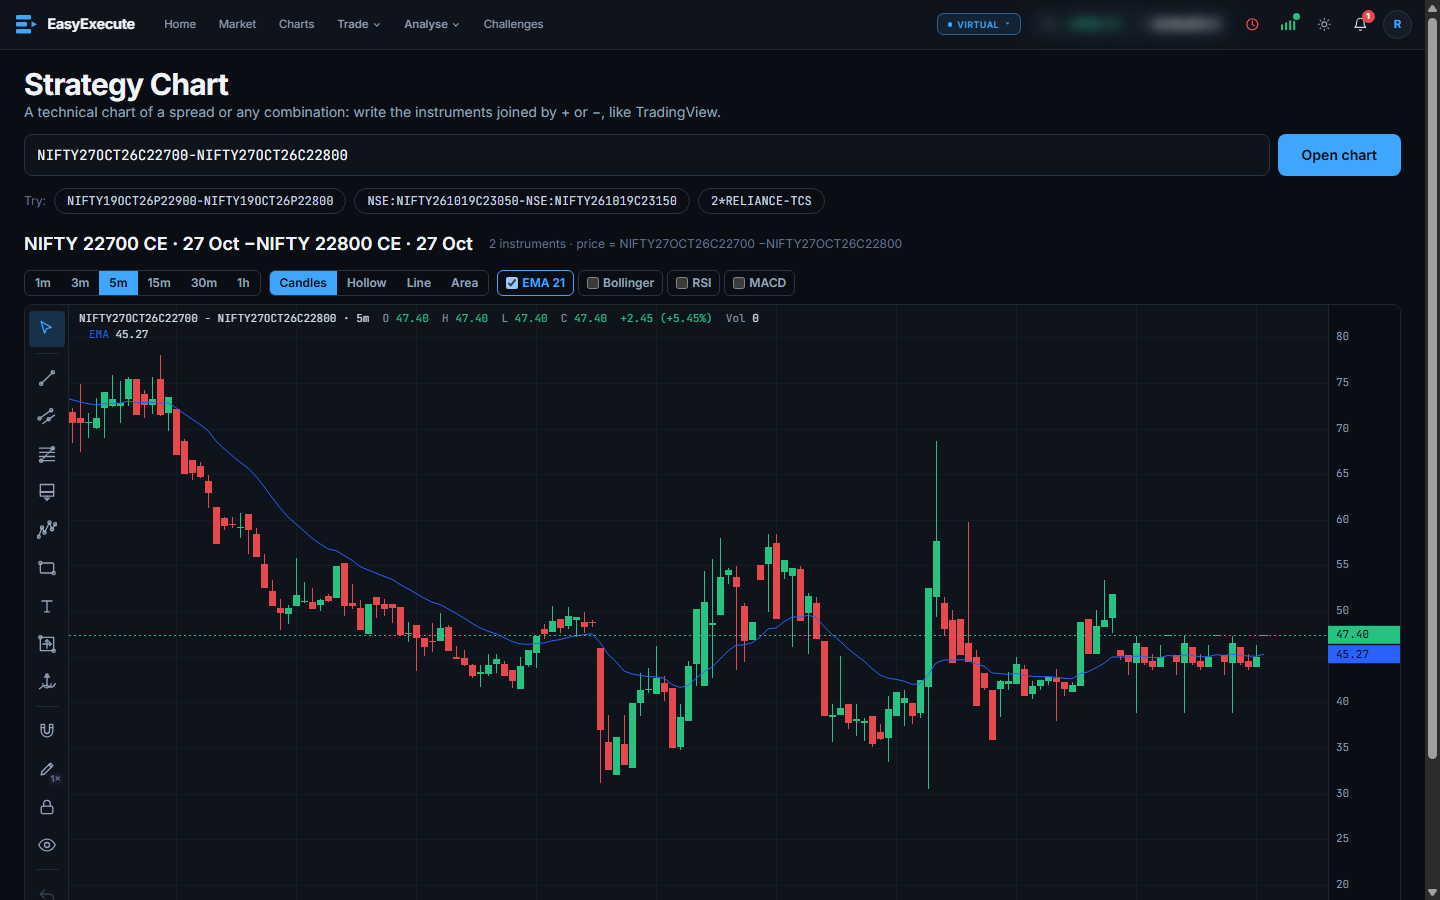
A technical chart of a spread or any combination.
Write the instruments joined by + or −, like on TradingView, and chart the combined price with the usual indicators and drawing tools.
What you can do
- Examples: a call spread as one call minus another (NIFTY27OCT26C22700-NIFTY27OCT26C22800), or 2*RELIANCE-TCS.
- Press Open chart to see the combined price, then change the time frame (1m to 1h) and the chart type (candles, hollow, line, area).
- Add EMA, Bollinger, RSI or MACD, and use the drawing tools on the combined price.
- Useful for spreads whose single legs say little on their own.