
Trade
Option stop calculator
See a stop as an underlying level and as an option premium.
A stop on an option is the same stop in two prices: the level of the underlying (the index or stock) and the premium the option would have there. The calculator shows both, so you can plan before you trade.
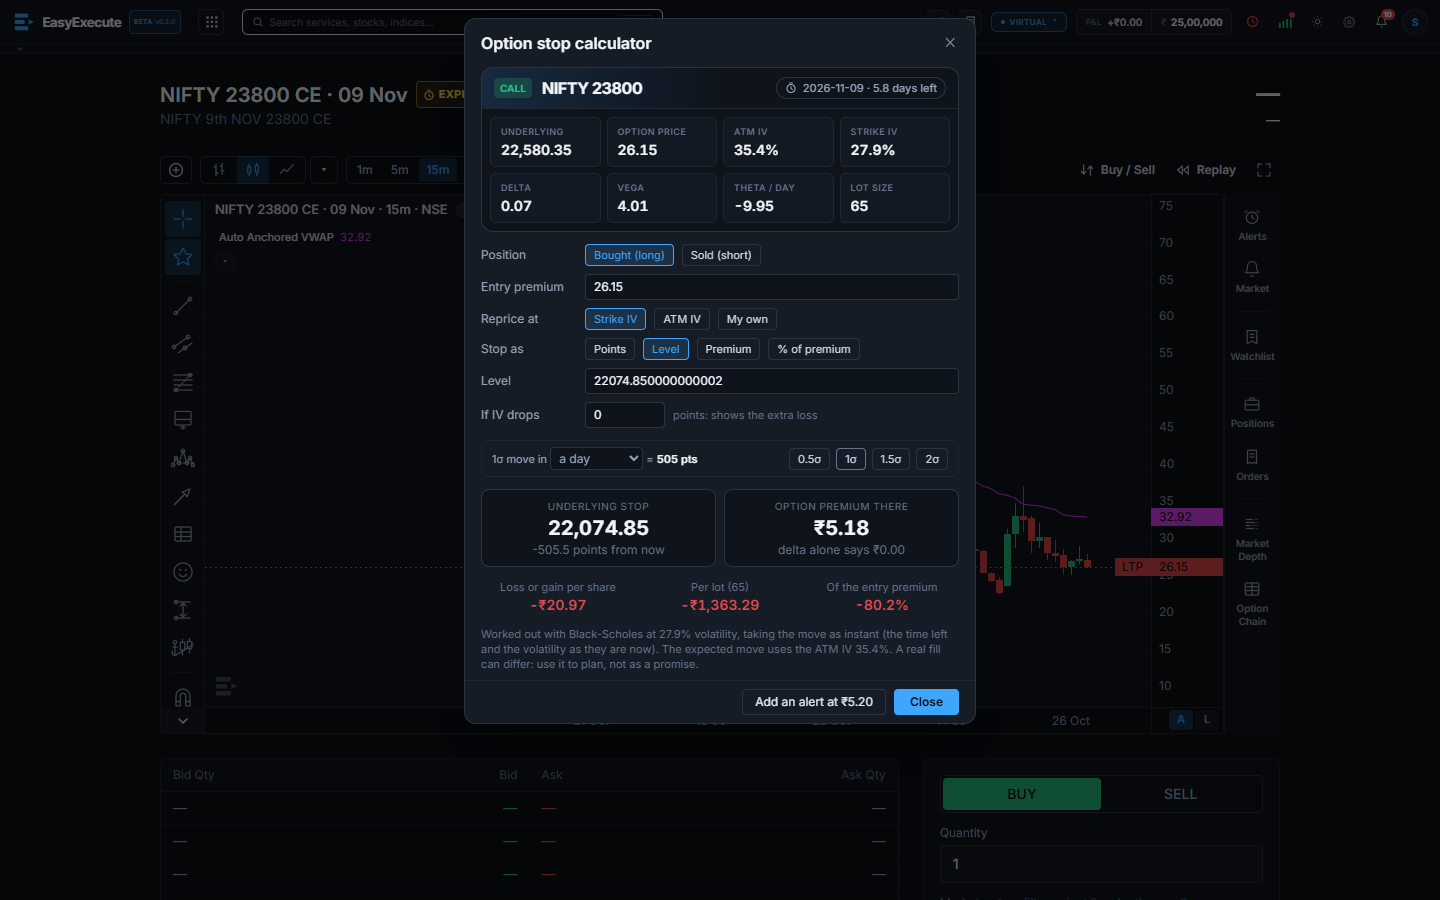
What you can do
- Open it with the calculator button in the header of an option chart. You can drag the window by its title.
- The top card shows the underlying, the option price, the ATM IV, the strike’s own IV, delta, vega, theta for a day and the lot size.
- Choose bought (long) or sold (short), and the entry premium. Then give the stop as points away, an underlying level, an option premium, or a percent of the premium.
- You get the underlying stop, the option premium there, the loss or gain per share, per lot and as a percent of the entry premium. Delta alone is shown beside the full figure, so you can see how far delta is from the truth.
- Reprice at: the strike’s own IV (the default, because it matches today’s price), the ATM IV, or a volatility you type. If the model price is far from the market price, the box warns you.
- If IV drops: type a number of volatility points to see the extra loss if the volatility also falls at that moment, as it can after news or near expiry.
- The 0.5σ, 1σ, 1.5σ and 2σ buttons put the stop one expected move away. The expected move comes from the ATM IV, for a day, an hour or until expiry.
- Add an alert at the premium turns the stop into an alert on the option’s price.
- The move is taken as instant: the time left and the volatility stay as they are now. Real prices can differ, so use it to plan, not as a promise. Near expiry the Greeks can be missing, and the box says so.