
Analyse
Stock Data
Price, range, moves, technicals and patterns of a stock or index.
Search for any stock or index and see everything about it on one page.
What you can do
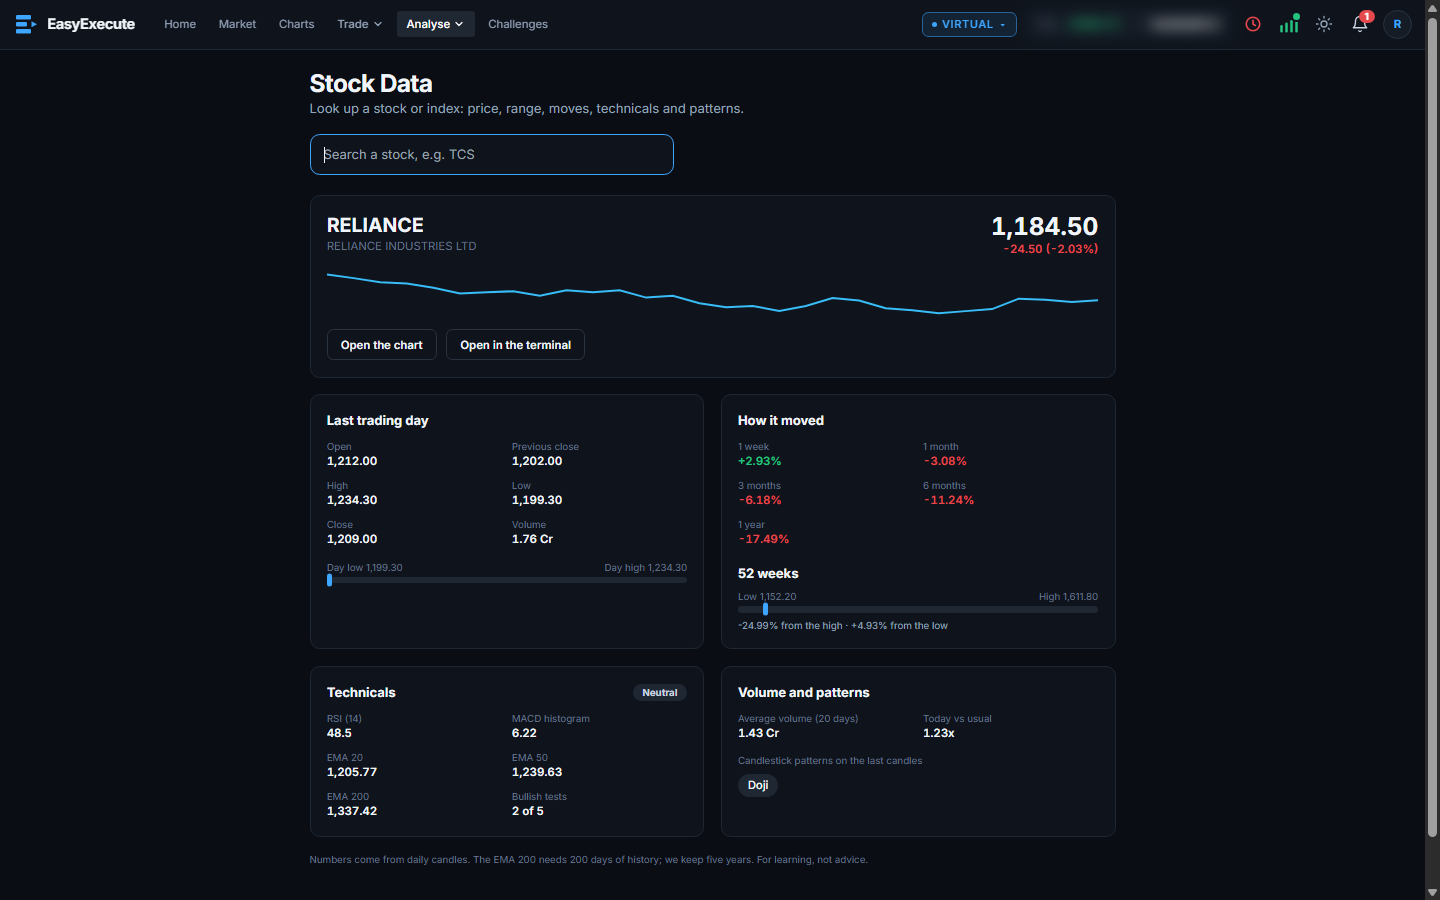
- The header: name, price, the day's change and a small price line, with buttons to open the chart or the terminal.
- Last trading day: open, previous close, high, low, close and volume, and where the price sits in the day's range.
- How it moved: 1 week, 1 month, 3 months, 6 months and 1 year, and the 52-week range with the distance from the high and the low.
- Technicals: an overall reading, RSI (14), MACD histogram, EMA 20, EMA 50 and EMA 200, and how many bullish tests pass.
- Volume and patterns: average volume, today against the usual, and candlestick patterns on the last candles.
Note. The numbers come from daily candles. The EMA 200 needs 200 days of history.