Trade
Charts
Candlestick charts, indicators, drawing tools and replay.
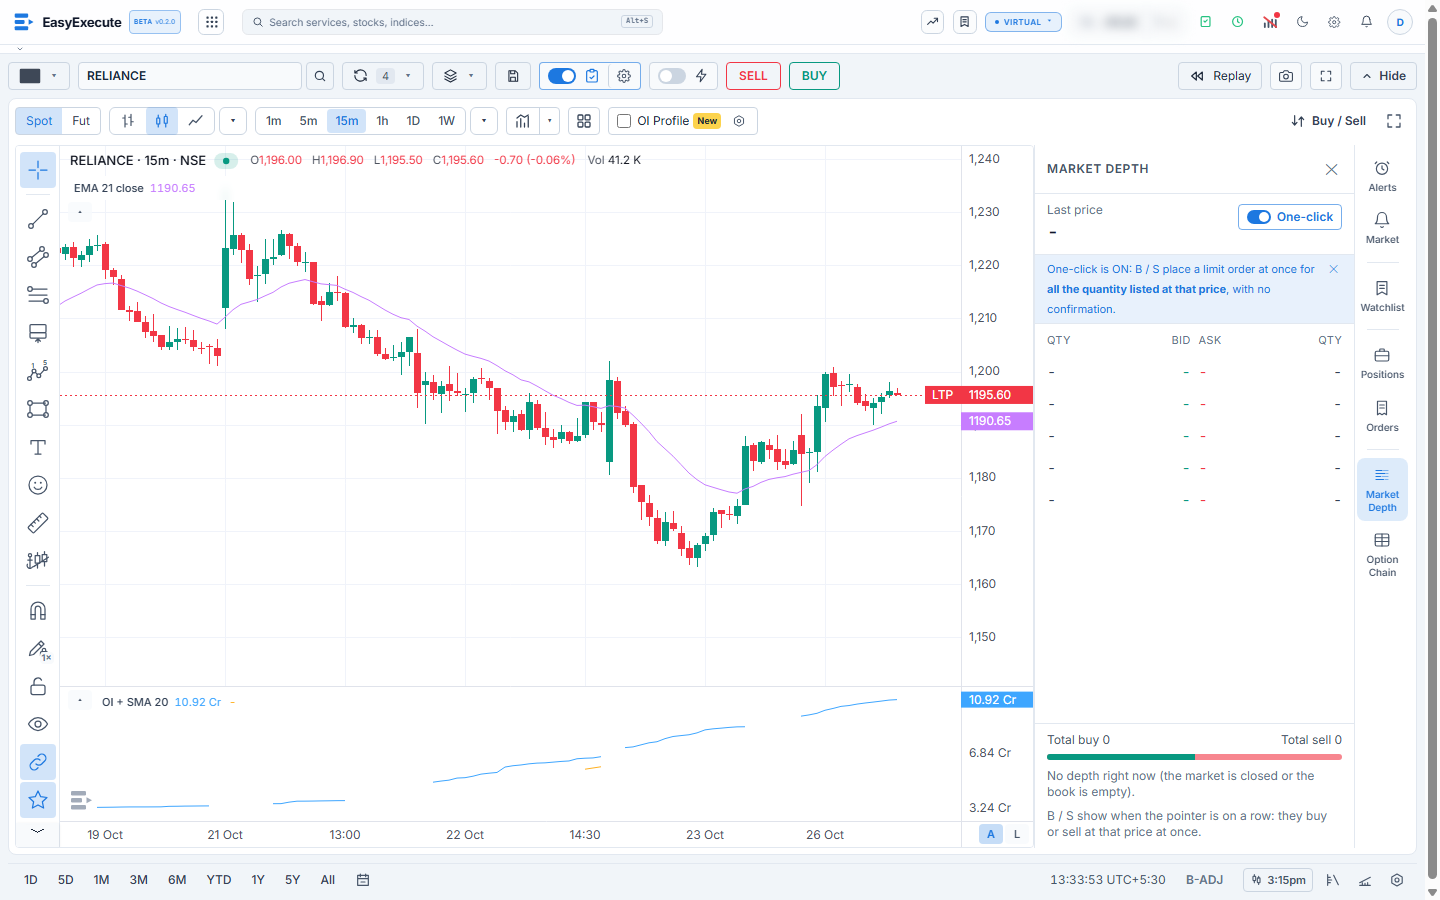
Charts are the centre of EasyExecute. Pick a symbol, choose spot or futures, and set the time frame from 1 minute to 1 week.
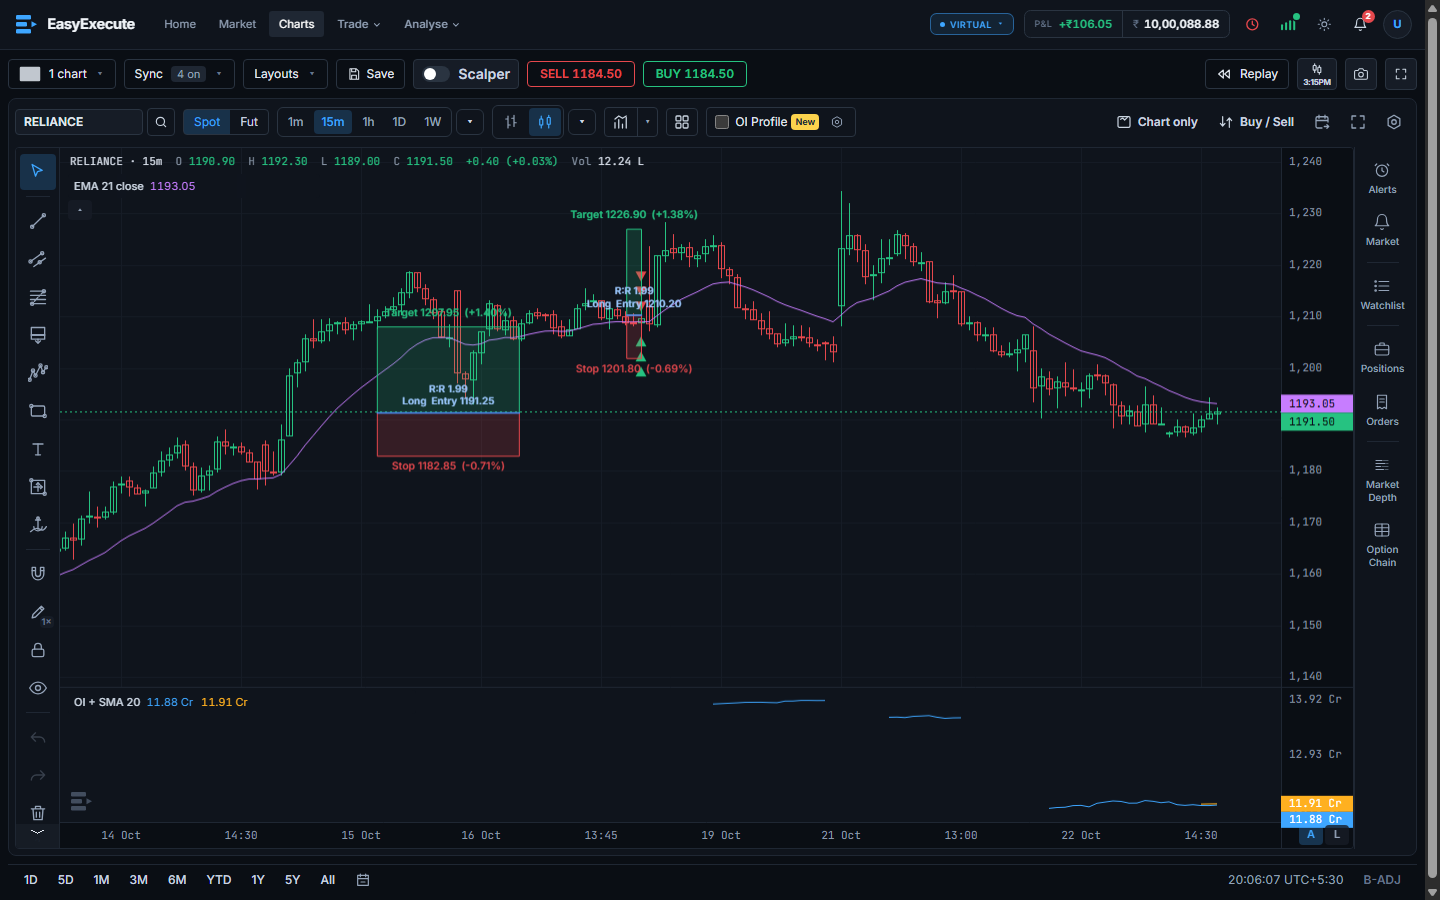
- Indicators, including EMA and VWAP, and an open-interest pane for futures and options.
- Drawing tools down the left: trend lines, channels, boxes, text, tables and position tools with target and stop. The Table tool is explained in Tables on the chart.
- Replay a past day candle by candle to practise.
- Buy and Sell straight from the chart, with the price shown on the buttons.
- A side panel for Alerts, Watchlist, Positions, Orders, Market depth and the Option chain.
- Layouts: show up to 9 charts on one screen, keep them in step with Sync (symbol, time frame, crosshair, scrolling and even indicators), and save the screen to open it again. See Layouts.
- Market depth: switch One-click on and a B and S button appears on every bid and ask row. One press places a limit order at once for the whole quantity listed at that price, with no confirmation, so use it with care. With One-click off the panel only shows the book.
- Clean charts: hide the price scale or the time scale with the small icons at the right of the bar under the chart (or from the right-click menu), and remove all drawings and indicators from the bin menu.
- Trade checklist: your own rules in a pop-up before each new order. See Trade checklist.
- Alerts on a trend line, ray or extended line: the alert follows the sloping line, on every price change or on a candle close. See Alerts on trend lines.
- Volatility Stop: a trailing stop-loss line set by ATR, historical volatility or implied volatility. See Volatility Stop.
- On an option chart: Strike IV (the implied volatility of that strike) and the Option stop calculator, which shows a stop as an underlying level and as a premium. See Strike IV and Option stop calculator.