
Analyse
Open Interest
Where the open interest sits, and how it changes.
See where the open interest sits across strikes, and how it moved during the day.
What you can do
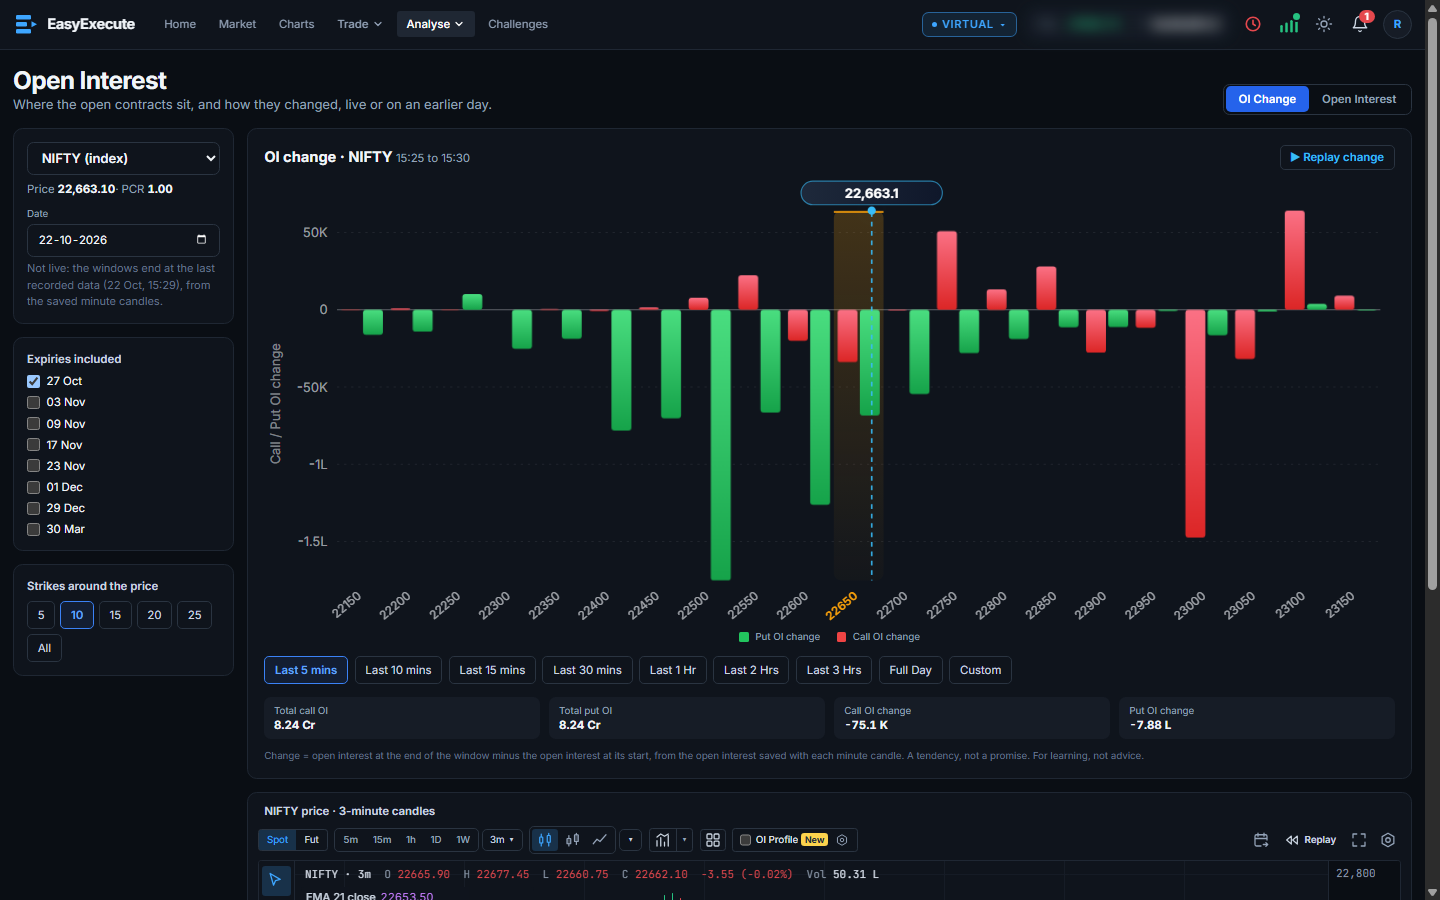
- Tabs for OI change and Open interest, for any index or stock, for today (live) or an earlier day.
- Choose the expiries to include, the strikes around the price and a time window: last 5, 10, 15 or 30 minutes, 1, 2 or 3 hours, the full day or a custom range.
- Bars show call OI (red) and put OI (green). “Show OI change” overlays added and removed open interest, and Replay change animates the window.
- Totals and PCR, with the underlying's 3-minute candles underneath.