
Trade
Strike IV
The implied volatility of an option’s own strike, bar by bar.
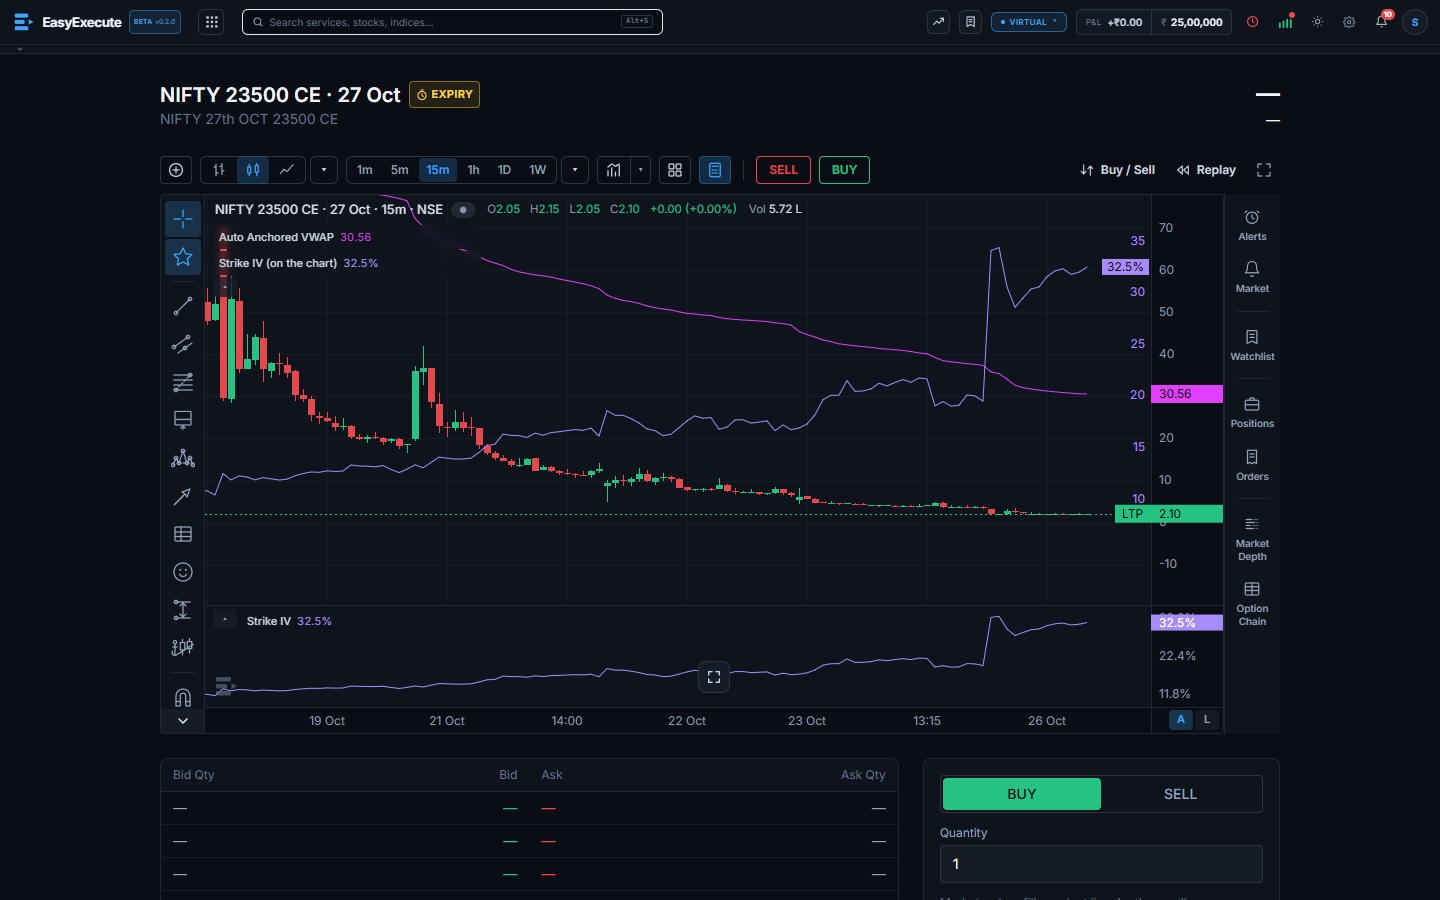
Strike IV shows what the price of one option says about volatility, on every candle. It is a yearly percentage. A rising line means the market is paying more for this option than before.
What you can do
- It works on an option’s own chart only. On a stock, an index or a future it is greyed out in the Indicators list.
- Strike IV (in a pane): the line sits in its own strip under the chart, with its own scale.
- Strike IV (on the chart): the same line is drawn over the candles on a scale of its own. The scale numbers are at the right inside the chart, and a tag shows the last value.
- It is worked out from the option’s price, the price of the underlying at the same time, the strike, the expiry and the interest rate. The chart gets the underlying’s prices by itself.
- The newest candle updates live, with the option’s price and the underlying’s price.
- Very cheap options, at the smallest price step, and options close to expiry can give no value or a very large one, because almost all of their price is intrinsic value.
- Use the strike’s IV together with the ATM IV and the India VIX. The IV Chart page shows the at-the-money IV through the day.