
Analyse
India VIX
The fear gauge, with a technical chart.
India VIX shows how much movement the market expects. High readings mean fear; low readings mean calm.
What you can do
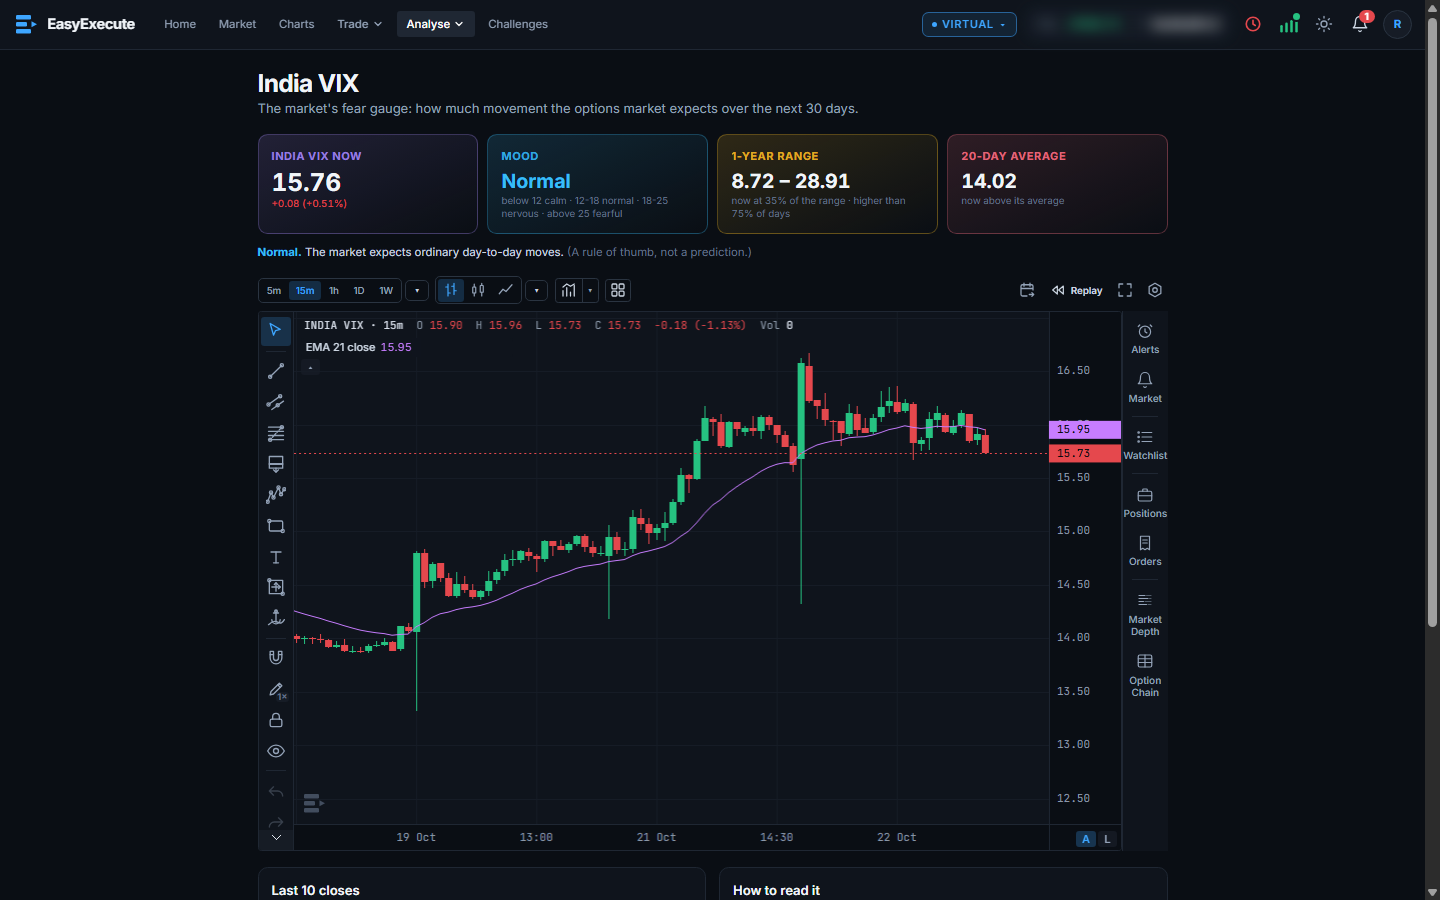
- The day's change and a mood label (calm, normal, nervous, fearful by the usual 12, 18 and 25 bands, as a rule of thumb).
- The 1-year range and where today's reading sits in it, and the 20-day average.
- A full technical chart of the VIX with every indicator and drawing tool (it is not tradable), and the last 10 closes.