
EasyExecute Charts: Indicators, Drawing Tools, Replay and 9-Chart Layouts
The chart is the centre of EasyExecute. Pick a symbol, choose spot or futures, set the time frame, and work.
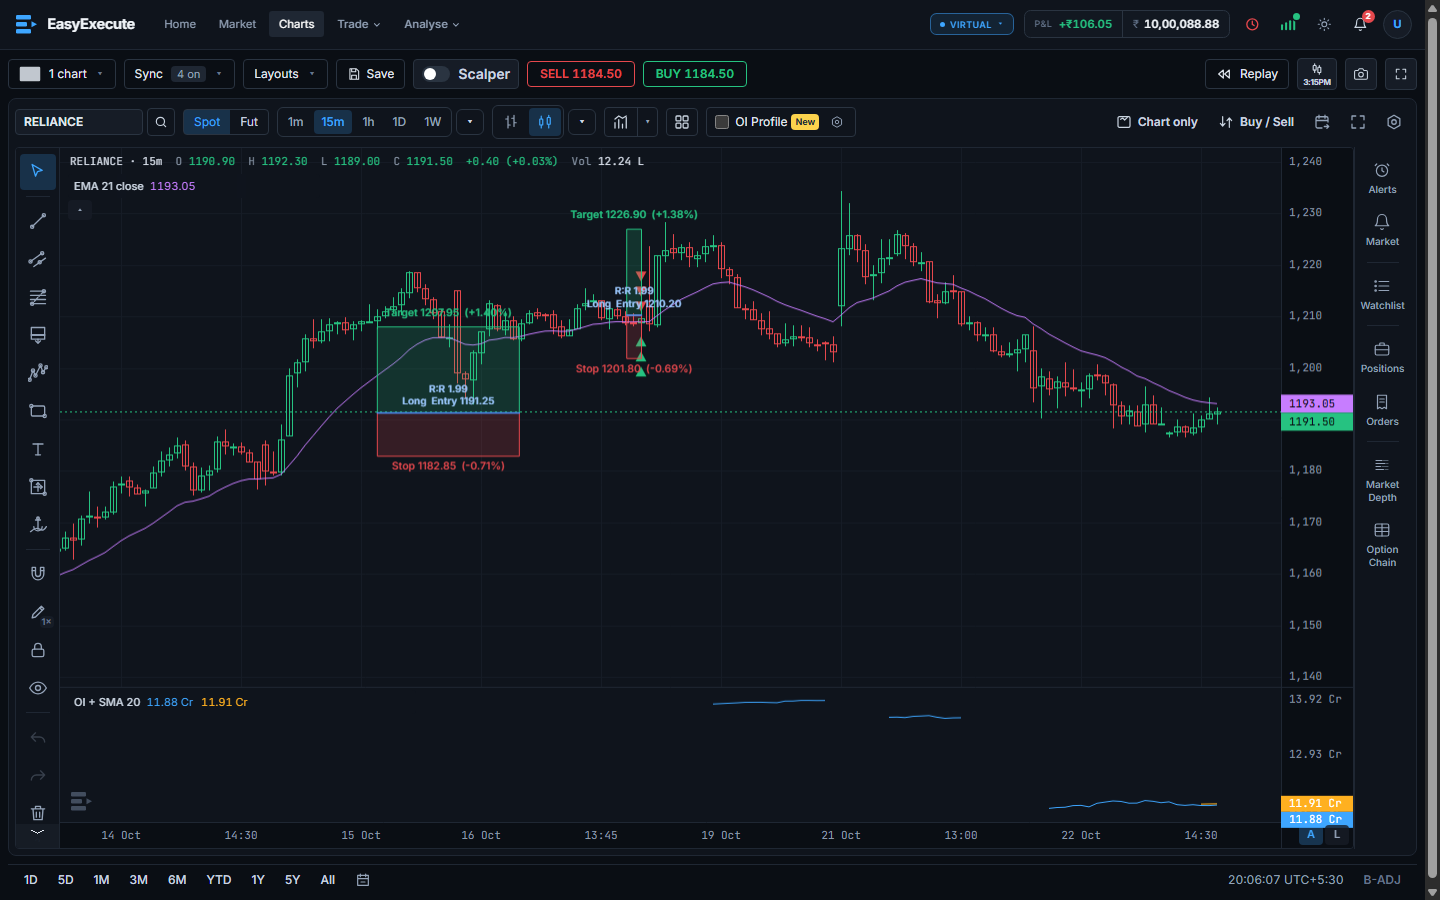
Indicators
Put up to 30 indicators on one chart. Some of the ones you can add:
- Moving averages: EMA, SMA, WMA and SMMA.
- VWAP, anchored VWAP, and the previous and current day VWAP.
- Bollinger Bands.
- RSI, MACD and stochastic.
- ADX with +DI and −DI, and ATR.
- Volume with its average, historical volatility, and open interest for futures and options.
Drawing tools
- Trend lines, horizontal and vertical lines, rays and cross lines.
- Parallel, disjoint and flat top / bottom channels.
- Fibonacci retracement and extension.
- Rectangles, circles, ellipses, arcs and triangles.
- Patterns and waves: head and shoulders, zigzag lines, polylines and paths.
- A measurer, a trend angle, text, notes, pins and arrows.
- Long and short position tools that show your target and stop on the chart.
Many charts, saved layouts
A layout is your whole screen saved: the symbols, time frames, indicators and drawings. You can keep 50 layouts. One click brings a setup back. Pick from arrangements such as 2 x 2, 3 columns, one big chart with two small ones, or 4 x 2.
Practise with replay
Replay a past day candle by candle. Decide before the next candle shows. It is the cheapest way to practise reading charts, because no money is at risk.
A chart you can act from
- Buy and Sell buttons on the chart show the live price.
- A side panel holds Alerts, Watchlist, Positions, Orders, Market depth and the Option chain.
- Chart combinations: write instruments joined by + or −, like a spread, and chart the combined price with the usual indicators.
- Straddle and strangle charts, an IV chart and an India VIX chart for options traders.
See how this compares with TradingView in EasyExecute vs TradingView. Want to try it? Join early access below.
Want to trade with EasyExecute?
Tell us in one minute what you would pay and what you expect. Early access members hear first when we open the doors.
Fill the early access form → Beta: open to a few invited users. Virtual account for now. No advice, no promise of profit.Questions people ask
How many indicators can I add on EasyExecute?
Up to 30 on one chart. The limit is the same on every account.
Which time frames are available?
From 1 minute up to 1 week.
Can I practise on past data?
Yes. Replay shows a past day candle by candle.
Can I place an order from the chart?
Yes. The chart has Buy and Sell buttons, and a long or short position tool. Orders go to your virtual account for now.